
Beyond Balancing Sheets: Discover 4 Everyday Uses of Excel Outside the Office
Beyond Balancing Sheets: Discover 4 Everyday Uses of Excel Outside the Office
Quick Links
- Budgeting
- Vacation Destinations With Different Criteria
- Tracking My Sports Team’s Stats
- Tracking My Weight (I’m on a Diet!)
Excel is often seen as a complicated program for highly trained accountants, but this isn’t necessarily the case. I use Excel daily to keep track of my budgeting, choose the ideal vacation destination, track my team’s sports stats, and keep an eye on my weight-loss progress… and you can too!

1. Budgeting
With today’s never-ending cost-of-living increases, I use Excel to manage my budgeting and keep track of how much disposable income I have left over each month.
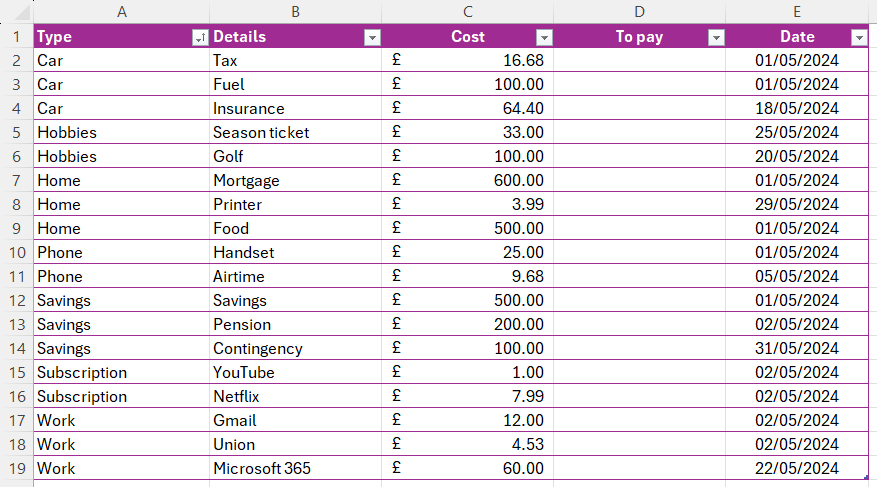
First, create an Excel table by typing Type, Details, Cost, To Pay, and Date in cells A1 to E1.
- The Type column is the category of the expenditure (useful for filtering later on).
- The Details column contains the specific information about what the cost is.
- The Cost column contains the specific price of the expenditure.
- Leave the To Pay column blank for now.
- The Date column reminds you of when the payment is due to be made.
Once you have input the data into columns A, B, C, and E, format your table and give your table a name . In my case, I’ve called it Budgeting.
Whenever you type a date in Excel, make sure the cell data type is set to “Date.” This will mean that Excel can use these dates to help you manage your budget automatically.
Now, in cell G1, type Today’s Date, in cell G2, type End of Month, and in cell G3, type Days Left.
In cell H1, type the following formula to generate today’s date:
=today()
In cell H2, type the last date of the current month manually.
In cell H3, type the following formula to calculate the number of days remaining in the month:
=SUM(H2-H1)
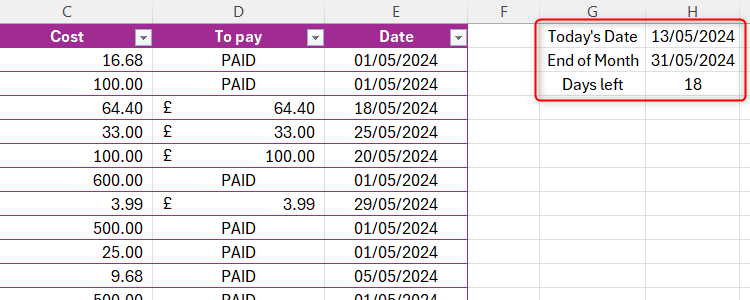
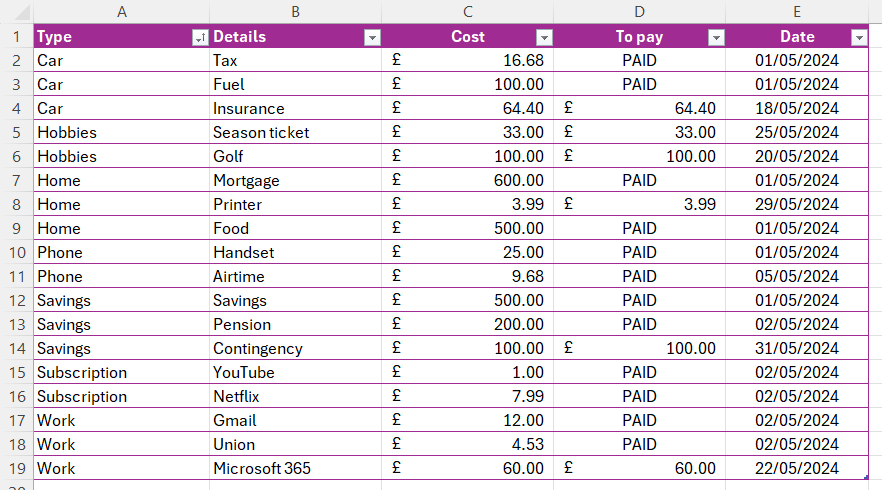
We’re now ready to populate column D. In cell D2, type
=IF([@Date]<$H$1,”PAID”,[@Cost])
This means that if the date of the payment item in row 2 is earlier than today’s date (in cell H1), we want Excel to mark it as Paid. If the date is later than today’s date, the total cost of that item will show in this cell. When you press enter after typing the formula, the rest of the column will populate automatically.
Finally, we can now use all this information to calculate our budget.
Underneath your formatted table, in column A, type Bank balance, Total expenditure, Total left to pay, Leftover, and Daily budget on separate rows. Then, you will need to add totals or formulas to the corresponding cells in column B as follows:
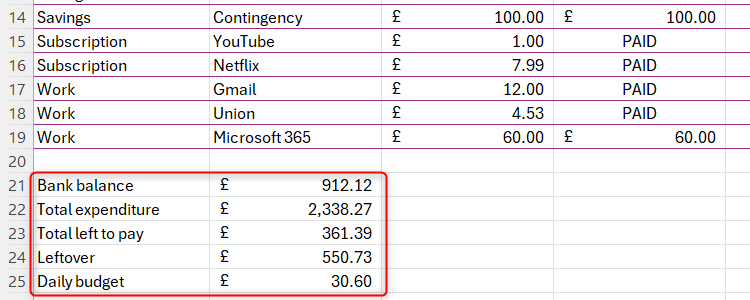
Type your bank balance manually. You should update this cell each time you return to check your budget.
Then, in the cell next to Total expenditure, type
=SUM(Budgeting[Cost])
where Budgeting is the name we assigned to our table, and [Cost] is the name of the column we’re totalling.
Now, in the cell next to Total left to pay, type
=SUM(Budgeting[To pay])
In the cell next to Leftover, type
=SUM(B21-B23)
where B21 is your manually-added bank balance, and B23 is the cell containing the total left to pay.
In the cell next to Daily budget, type
=SUM(B24/H3)
where B24 is the total leftover, and H3 is the number of days remaining in the month.
You now have a complete monthly budgeting spreadsheet. Simply duplicate the sheet each month to set up a new budget. Then, amend that month’s payment details, change the last day of the month in cell H2, and keep your bank balance updated.
2. Vacation Destinations With Different Criteria
With so many options for different vacation destinations, Excel can help you keep these in order. Yes, there are websites that can help you with some criteria, but how about those specific elements that matter to you, such as property with a fireplace, or a region with a dark sky for those of you who love stargazing? Whatever it is you’re looking for, use Excel to whittle down your options without having to pay that extra percentage for third-party booking commissions.
I love going on short stays around the UK, and this spreadsheet started off with a few notes about some of the properties that tickled my fancy. But as I stayed at more places, I started to realize what elements mattered to me the most, and my spreadsheet quickly expanded.
Here are some of the tools I benefit from the most when using my spreadsheet:
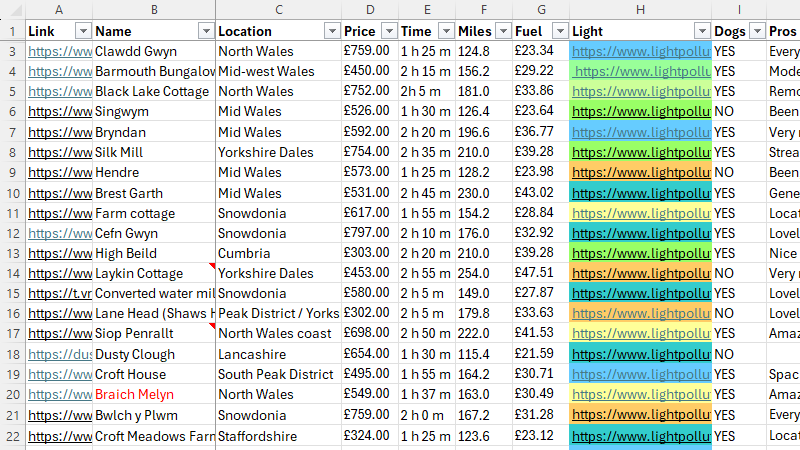
- Freeze panes : With my spreadsheet being so vast, I decided to freeze the property link and name columns and the header row. This means that, whenever I scroll across or down, those parts remain visible. In the example above, I selected cell C3, and in the View tab on the ribbon, I clicked “Freeze Panes” to freeze row 1 and columns A and B.
- Filters : The whole purpose of this spreadsheet is to help me choose which property to go to based on specific criteria. So, I added a filter to my spreadsheet. I selected the whole of row 1, headed to the Data tab on the ribbon, and clicked the “Filter” button. Now, I can use the filter drop-down arrows in each column to nitpick my preferences. For example, I can order the price from lowest to highest in column D, remove all properties that don’t allow dogs in column I, and filter by color according to the light pollution in column H.
- Hidden rows and columns containing formulas: I have hidden row 2 in my spreadsheet because I’ve added details in columns F and G that I don’t want to display on my sheet or be included in the filters I apply. In cell F2, I typed my car’s miles per gallon, and in cell G2, I converted the total gallons to liters, so that I could work out the fuel cost for the trip. To hide a row or column, right-click on the gray header (the column letter or column number), and click “Hide.”
- Color code: As an avid stargazer, I use a light pollution map to find out whether there’s a good chance of seeing the Milky Way. I then use Excel’s color fill to match the cell color with the light pollution indicator. Blues on the map represent little light pollution, while yellows and oranges represent heavy light pollution. I can then filter column H by color to see which properties are likely to offer the best skies.
- Notes : Notice the red markers on cells B14 and B17. These show that I’ve added a note to that cell that I didn’t want to add as an extra column to the spreadsheet. For example, in B14, I made a note that the minimum stay at that property is five nights. To do this, simply right-click the relevant cell, and click “New Note.”
3. Tracking My Sports Team’s Stats
This is my favorite Excel workbook. Like with most spreadsheets, they started off really simple, and I’ve gradually added to them over time.
The best tools for creating these spreadsheets have been conditional formatting and charts.
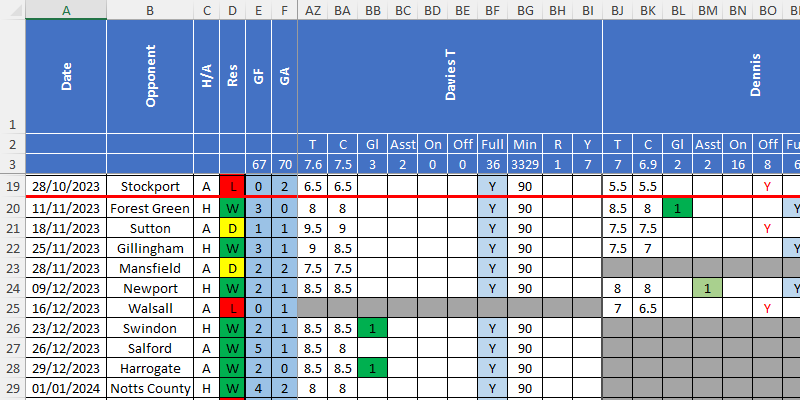
As you can see in the screenshot above, I’ve used conditional formatting to automatically apply color to cells based on their values (such as red for L, yellow for D, and green for W). To do this, I selected the whole of column D, opened “Conditional Formatting” in the Home tab, and clicked “New Rule.” I then clicked “Format Only Cells That Contain” and completed the details of the rule in the easy-to-follow dialog box.
On this sheet, I’ve used an in-built conditional formatting rule to create data bars. I selected column B, clicked “Conditional Formatting” in the Home tab, and hovered over “Data Bars.” I could then choose the data bar type that best aligned with my spreadsheet’s formatting. Then, I used the Format Painter tool to apply the same rules to the other columns, alternating between blue and green for clarity.
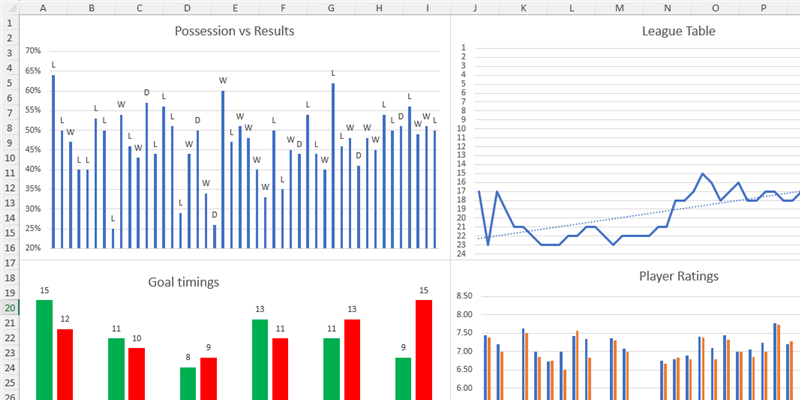
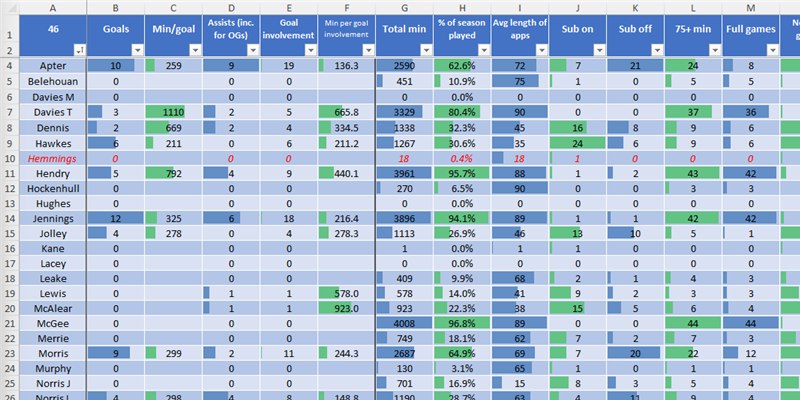
My sports team tracking workbook contains 12 tabs overall, so I created a dashboard sheet that pulls together the key information in chart form in one place. Click the “+” at the bottom of your workbook to add a new sheet, and double-click the new tab to rename it Dashboard. Then, use the Charts group in the Insert tab on the ribbon to choose different graphs that will work well for your data. Finally, you can format your data labels and chart colors to make them look exactly how you want, and hide the gridlines to add that extra presentational touch to your dashboard.
4. Tracking My Weight (I’m on a Diet!)
Who knew that Excel could be a weight-loss motivator?
![]()
Using Excel’s formatted table function and line chart, I created a spreadsheet to track my weight and show me how close to my target I am getting:
- Start by creating a table by typing Date, Weight, and Target into cells A1, B1, and C1, respectively. Once you have your first row of data, highlight all the cells in the table (including the headers), and head to the Home tab. From there, in the Styles group, click “Format As Table,” and check the “My Table Has Headers” box.
- Next, you should name your table. Click anywhere on your formatted table, and in the Table Design tab, rename the table as Weight in the Table Name field on the left.
- Now, click anywhere on the table again, and click the “Line Chart” option in the Insert tab.
- Finally, double click anywhere on your newly created chart to format its design and amend the axis options to suit your needs.
To add a new row for the next day’s data, right-click the bottom row of your table, hover over “Insert,” and click “Table Row Below.”
Once you start using Excel for your everyday dealings, you’ll undoubtedly find even more uses for this dynamic program, and using these little-known Excel functions can help you to make your spreadsheets more adaptable to your needs.
ending
Also read:
- [New] Comprehensive Angles in Filming versus Diverse Dimensions for 2024
- [Updated] 2024 Approved Windows Screencast Champions Revealed
- [Updated] In 2024, Essential Tips for Gameplay Screen Captures on Xbox One
- [Updated] No-Fuss Trick for Clownfish Tone Change in Windows Domain for 2024
- Accelerated Record Functionality & Narrator Support
- Dark Souls 지미: Crashes and Bugs? Here's How You Can Resolve Them!
- Expert Tips: Eradicated Common Causes of Black Screens on Electronics
- Immediate Fixes for Combat Arms Delays - Streamlined Approach
- In 2024, 5 Best Route Generator Apps You Should Try On Infinix Note 30 Pro | Dr.fone
- In 2024, How to Unlock Apple iPhone 12 Pro Passcode without iTunes without Knowing Passcode?
- Step-by-Step Guide: Stabilizing Forza Horizon 5 Performance on Personal Computers
- Step-by-Step Solutions to Stop V Rising From Freezing or Crashing
- Warno Not Working Properly on PC? Here Are Solutions to Stabilize Your Gameplay
- Title: Beyond Balancing Sheets: Discover 4 Everyday Uses of Excel Outside the Office
- Author: Mark
- Created at : 2024-11-12 16:00:35
- Updated at : 2024-11-15 16:28:48
- Link: https://win-solutions.techidaily.com/beyond-balancing-sheets-discover-4-everyday-uses-of-excel-outside-the-office/
- License: This work is licensed under CC BY-NC-SA 4.0.